Blog Archive

Friday, January 31, 2014

California's Drought and Climate change

from Climate Nexus

Introduction

Now in the midst of a three-year drought, California endured its driest calendar year on record in 2013 and is currently on-track for its driest water year in nearly 500 years.  A minor winter storm the last week of January provided little relief. The month-end survey of the state’s critically important snow pack revealed the lowest January water content on record.

Climate change is intensifying the drought by driving record-breaking warm temperatures that are evaporating the snow pack and drying out soils.  In addition, climate change may be at least partly responsible for the unprecedented high-pressure weather pattern (known as the “ridiculously resilient ridge”) that is blocking storms from the state.


Contributors to Drought

Loss of Snowpack
Much of California (especially Northern California) relies on snowpack in the Sierra Nevada Mountains to store water during the winter and slowly release it over the course of the spring and summer. Snowpack provides about a third of California’s total water supply. 

After a month of record-breaking temperatures and scant precipitation, January 30, 2014, snowpack levels hit an all-time low: 12% of normal. Reservoirs that hold snowpack run-off to carry the state through its summer dry season are now at critically low levels, as snow pack has been near record lows for three years running.  

Higher temperatures associated with climate change play a role in intensifying the drought. Warmer conditions mean that mountain snows melt earlier, and the resulting moisture evaporates from soils faster. Dr. Valerie Trouet, Assistant Professor in the Laboratory of Tree-Ring Research at the University of Arizona, explains, “What we are seeing now is fundamentally different from previous mega-droughts, which were driven largely by precipitation. Now, thanks to higher temperatures driven by climate change, droughts are increasingly temperature-driven.”

In line with this trend, California has been experiencing record high temperatures this winter. For the people of Los Angeles, already accustomed to mild winter weather, Christmas Day was balmy enough for sunbathing on the beach in Santa Monica. 

Reduced Precipitation
Over the long-term, changing weather patterns may also be reducing winter precipitation. Records show that over the past century, total annual precipitation in California has declined

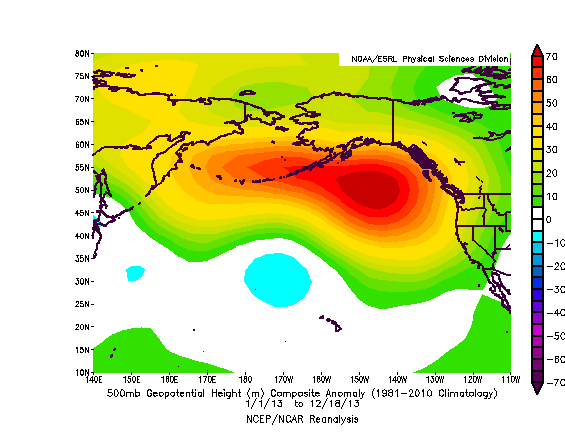
In 2013, a high-pressure zone formed over the Pacific Ocean, diverting precipitation towards Alaska (where the record warmth and precipitation has caused avalanches). While these zones are common, they normally quickly change position. The current high-pressure “ridge” is unprecedented in modern weather records in that it has remained in place for 13 months, held by a large, static bend in the jet stream. 

Scientists are beginning to detect a connection between these abnormal jet stream waves and the warming of the Arctic. The Arctic is warming faster than the rest of the globe, reducing the temperature differential on each side of the jet stream. This may cause the jet stream to slow down, which in turn allows it to deviate from its straight path and cause these “stuck in place” weather patterns. 

In fact, a 2005 study actually predicted the impact of Arctic warming on Californian precipitation using climate models, which produced a similar high-pressure ridge to the one that has remained in place throughout 2013. For more on the relationship between the jet stream and global warming, please refer to this Climate Nexus backgrounder.

The Big Picture
One of the hallmarks of climate change is that, on average, wet regions are getting wetter and dry regions are getting drier (IPCC AR5 WGI SPM, p. 3). The Southwestern U.S. is a naturally dry region, and experts predict that it will get drier as climate change continues. 

There is strong physical evidence to show that in medieval times droughts in California lasted for decades, and some experts fear that the severity of the current drought could portend a similarly long stretch of very dry conditions. This has further implications for California’s drought in that it will limit the ability of Californian cities to compensate by drawing water from other areas. 

For example, the Colorado River provides much of the water used by Las Vegas, Los Angeles, and the surrounding farmland. However, the river itself is experiencing drought conditions “nearly unrivaled in 1,250 years.” The Rocky Mountains aren’t providing the meltwater the river needs, any more than the Sierra Nevadas are providing for Northern California. Drought across the entire region means tough questions about how water will be shared.


Impacts

In early January, the state announced that would it would likely be able to deliver only five percent of the slightly more than four million acre-feet of State Water Project (SWP) water requested by the 29 public agencies that supply more than 25 million Californians and nearly a million acres of irrigated farmland in 2014. This ties with calendar year 2010 for the lowest initial allocation ever.  The 2013 final allocation was only 35%.  

Agriculture
Overall, this drought could increase the prices of staples such as meat, milk, fruit and vegetables around the country. In fact, the price of milk futures rose to its highest point on record in January, which is a signal that demand remains high as producers are struggling with drought conditions.  

According to the USDA, long-term drought on a national level has forced ranchers to thin their livestock herds “to the lowest level in decades.” One cattleman interviewed by The San Francisco Chronicle said that he was considering selling nearly 40% of his cattle.

California produces nearly half of the nation's fruits, nuts and vegetables. According to the California Department of Food and Agriculture, the state holds 80,500 farms and ranches, which together generate more than $100 billion in economic activity. According to industry group California Farm Water Coalition, lost revenue for farming and associated businesses like trucking and processing could reach $5 billion in 2014 alone

Based on Governor Jerry Brown’s request that the public, business, and government agencies reduce their water use by 20%, farmers will likely have to choose between pumping more local groundwater, changing crops or leaving their land fallow as water availability decreases and prices increase.

Winemakers are concerned about how the drought will affect their grapes. One winemaker said that his vineyard saw less than two inches of rain in 2013, while 12 inches per year is average. The drought has caused the reservoirs at Shafer Vineyards in Napa Valley to dry up for the first time in 30 years. Vineyards that use water for frost protection are also in jeopardy. 

Fisheries
Based on previous droughts, it is likely that the fisheries along the Sacramento-San Joaquin River Delta will suffer as water is directed towards urban and agricultural uses. As they have in the past, agricultural agencies and environmentalists might file lawsuits to protect their rights to water for crops and fish habitat.  

The famed Coho salmon run of Central California will also likely suffer due to the lack of rain this winter.  Coho salmon are endangered, and the starkly lower water levels means that they cannot migrate up the coastal rivers and creeks to spawn, which will severely threaten the next generation of salmon.

People and the Economy
The state warned on January 28, 2014, that seventeen communities across the state were in danger of running out of water within 60 to 120 days.  Federal officials are considering seizing water stored by some California to serve users with senior water rights. As an example of the overall financial toll drought can take, the 2012 national drought cost the U.S. $30 billion.

Over the last few years, California has been riding an economic resurgence following the 2008 recession; but as Governor Jerry Brown warned in his annual address to the State Legislature in January, the severity and uncertainties over the current drought threaten to slow this recovery.

Droughts are also known to threaten human health by making air pollution worse and increasing respiratory health issues for people with conditions like allergies and asthma.  

Wildfires
Early snowmelt leaves the Sierras vulnerable to fire. There have been fires around Lake Tahoe for this reason in the past, and one small fire nearby in Nevada already in 2014. Fire officials are on edge, saying “Normally in the area where we have this fire we have 5 to 10 feet of snow… [But] We have no snow in the area." In Southern California, lack of precipitation exacerbates fire as well. Red-flag fire warnings have been issued in Southern California this January, and the Colby fire has burned over 1,900 acres.

The EPA has warned that “more frequent and more severe droughts” are associated with the observed increases in wildfires, especially in the Southwestern U.S.  Over the last few decades, the American West has had nearly four times as many wildfires as it did in the preceding decades, and these fires have burned more than six times the land area and lasted almost five times as long.  

Energy Generation
In a non-drought year, California typically gets 15% of its total power from hydroelectric generation. The drought could dramatically cut this figure, with potentially significant consequences for homes and businesses. Estimates show that in 2013, California’s hydropower generation fell by over 22% compared to 2012, and water levels in energy-generating reservoirs are still dropping. 

Reductions in hydropower generation have been costly in the past. An analysis by the Pacific Institute estimated that the 2007-09 drought cost Californian ratepayers $1.7 billion to replace lost hydropower with natural gas generation.  The analysis also concluded, “some of the drought’s most direct and costly impacts were to air quality and California electricity ratepayers.”

http://climatenexus.org/wp-content/uploads/2014/01/CAdrought.pdf

Leading Scientists Explain How Climate Change Is Worsening California’s Epic Drought

by Joe Romm, Climate Progress, January 31, 2014

Scientists have long predicted that climate change would bring on ever-worsening droughts, especially in semi-arid regions like the U.S. Southwest. As climatologist James Hansen, who co-authored one of the earliest studies on this subject back in 1990, told me this week, “Increasingly intense droughts in California, all of the Southwest, and even into the Midwest have everything to do with human-made climate change.”

Why does it matter if climate change is playing a role in the Western drought? As one top researcher on the climate-drought link reconfirmed with me this week, “The U.S. may never again return to the relatively wet conditions experienced from 1977 to 1999.” If his and other projections are correct, then there may be no greater tasks facing humanity than (1) working to slash carbon pollution and avoid the worst climate impact scenarios and (2) figuring out how to feed nine billion people by mid-century in a Dust-Bowl-ifying world.

Remarkably, climate scientists specifically predicted a decade ago that Arctic ice loss would bring on worse droughts in the West, especially California. As it turns out, Arctic ice loss has been much faster than the researchers — and indeed all climate modelers — expected.
And, of course, California is now in the death-grip of a brutal, record-breaking drought, driven by the very change in the jet stream that scientists had anticipated. Is this just an amazing coincidence — or were the scientists right? And what would that mean for the future? Building on my post from last summer, I talked to the lead researcher and several other of the world’s leading climatologists and drought experts.
20140128_west_drought
First, a little background. Climate change makes Western droughts longer and stronger and more frequent in several ways, as I discussed in my 2011 literature review in the journal Nature:
Precipitation patterns are expected to shift, expanding the dry subtropics. What precipitation there is will probably come in extreme deluges, resulting in runoff rather than drought alleviation. Warming causes greater evaporation and, once the ground is dry, the Sun’s energy goes into baking the soil, leading to a further increase in air temperature. That is why, for instance, so many temperature records were set for the United States in the 1930s Dust Bowl; and why, in 2011, drought-stricken Texas saw the hottest summer ever recorded for a US state. Finally, many regions are expected to see earlier snowmelt, so less water will be stored on mountain tops for the summer dry season.
I labeled this synergy Dust-Bowlification. The West has gotten hotter thanks to global warming, and that alone is problematic for California.
“The extra heat from the increase in heat trapping gases in the atmosphere over six months is equivalent to running a small microwave oven at full power for about half an hour over every square foot of the land under the drought,” climatologist Kevin Trenberth explained to me via email, during a drought. “No wonder wild fires have increased! So climate change undoubtedly affects the intensity and duration of drought, and it has consequences. California must be very vigilant with regard to wild fires as the spring arrives.”
And then we have the observed earlier snow melt, which matters in the West because it robs the region of a reservoir needed for the summer dry season — see “US Geological Survey (2011): Global Warming Drives Rockies Snowpack Loss Unrivaled in 800 Years, Threatens Western Water Supply” and “USGS (2013): Warmer Springs Causing Loss Of Snow Cover Throughout The Rocky Mountains.”
As climatologist and water expert Peter Gleick noted to me, quite separate from the impact of climate change on precipitation, “look at the temperature patterns here, which are leading to a greater ratio of rain-to-snow, faster melting of snow, and greater evaporation. Those changes alone make any drought more intense.”
But what of the possibility that climate change is actually contributing to the reduction in rainfall? After all, as Daniel Swain has noted, “calendar year 2013 was the driest on record in California’s 119 year formal record, and likely the driest since at least the Gold Rush era.”
Trenberth explained that, according to climate models, “some areas are more likely to get drier including the SW: In part this relates a bit to the “wet get wetter and dry get drier” syndrome, so the subtropics are more apt to become drier. It also relates to the expansion and poleward shift of the tropics.”
Back in 2005, I first heard climatologist Jonathan Overpeck discuss evidence that temperature and annual precipitation had started to head in opposite directions in the U.S. Southwest, which raises the question of whether we are at the “dawn of the super-interglacial drought.” Overpeck, a leading drought expert at the University of Arizona, warned “climate change seldom occurs gradually.”
In a major 2008 USGS report, Abrupt Climate Change, the Bush Administration (!) warned:
“In the Southwest, for example, the models project a permanent drying by the mid-21st century that reaches the level of aridity seen in historical droughts, and a quarter of the projections may reach this level of aridity much earlier.”
In 2011 US Senate testimony, Overpeck stated:
There is broad agreement in the climate science research community that the Southwest, including New Mexico, will very likely continue to warm. There is also a strong consensus that the same region will become drier and increasingly snow-free with time, particularly in the winter and spring. Climate science also suggests that the warmer atmosphere will lead to more frequent and more severe (drier) droughts in the future. All of the above changes have already started, in large part driven by human-caused climate change.
Overpeck told me this week, “because I think the science only gets stronger with time, I’ll stick to my statements that you quote.” He added, “what’s going on in the Southwest is what anthropogenic global warming looks like for the region.”
Beyond the expansion and drying of the subtropics predicted by climate models, some climatologists have found in their research evidence that the stunning decline in Arctic sea ice would also drive western drought — by shifting storm tracks.
“Given the very large reductions in Arctic sea ice, and the heat escaping from the Arctic ocean into the overlying atmosphere, it would be surprising if the retreat in Arctic sea ice did *not* modify the large-scale circulation of the atmosphere in some way,” Michael Mann, director of the Earth System Science Center at Pennsylvania State University, told me this week. “We now have a healthy body of research, ranging from Lisa Sloan’s and Jacob Sewall’s work a decade ago, to Francis’s more recent work, suggesting that we may indeed be seeing already this now in the form of more persistent anomalies in temperature, rainfall, and drought in North America.”

arctic-sea-ice-cubes-2013
Back in 2004, Lisa Sloan, professor of Earth sciences at UC Santa Cruz, and her graduate student Jacob Sewall published an article in Geophysical Research Letters, “Disappearing Arctic sea ice reduces available water in the American west” (subs. req’d).
As the news release at the time explained, they “used powerful computers running a global climate model developed by the National Center for Atmospheric Research (NCAR) to simulate the effects of reduced Arctic sea ice.” And “their most striking finding was a significant reduction in rain and snowfall in the American West.”
“Where the sea ice is reduced, heat transfer from the ocean warms the atmosphere, resulting in a rising column of relatively warm air,” Sewall said. “The shift in storm tracks over North America was linked to the formation of these columns of warmer air over areas of reduced sea ice in the Greenland Sea and a few other locations.”
Last year, I contacted Sloan to ask her if she thought there was a connection between the staggering loss of Arctic sea ice and the brutal drought gripping the West, as her research predicted. She wrote, “Yes, sadly, I think we were correct in our findings, and it will only be worse with Arctic sea ice diminishing quickly.”
This week, Sewall wrote me that “both the pattern and even the magnitude of the anomaly looks very similar to what the models predicted in the 2005 study (see Fig. 3a).” Here is what Sewall’s model predicted in his 2005 paper, “Precipitation Shifts over Western North America as a Result of Declining Arctic Sea Ice Cover”:

Figure 3a. Differences in DJF [winter] averaged atmospheric quantities due to an imposed reduction in Arctic sea ice cover. The 500-millibar geopotential height (meters) increases by up to 70 m off the west coast of North America. Increased geopotential height deflects storms away from the dry locus and north into the wet locus
“Geopotential height” is basically the height above mean sea level for a given pressure level. The “500-mb level is often referred to as the steering level as most weather systems and precipitation follow the winds at this level…. This level averages around 18,000 feet above sea level and is roughly half-way up through the weather producing part of the atmosphere called the troposphere.”
Now here is what the 500-mb geopotential height anomaly looked like over the last year, via NOAA:
Look familiar? That is either an accurate prediction or one heck of a coincidence. The San Jose Mercury News described what was happening in layman’s terms:
… meteorologists have fixed their attention on the scientific phenomenon they say is to blame for the emerging drought: a vast zone of high pressure in the atmosphere off the West Coast, nearly four miles high and 2,000 miles long, so stubborn that one researcher [Swain] has dubbed it the “Ridiculously Resilient Ridge.”
Like a brick wall, the mass of high pressure air has been blocking Pacific winter storms from coming ashore in California, deflecting them up into Alaska and British Columbia, even delivering rain and cold weather to the East Coast.
This high pressure ridge is forcing the jet stream along a much more northerly track. Sewall told me that multiple factors are driving drought in California:2013 anomaly
There are, of course, caveats. This is one year, the model studies were looking at averages of multiple decades (20 or 50 years). There are other factors besides the Arctic ice that influence storm tracks; some preliminary work suggests that a strong El Nino overwhelms any influence of the ice. In El Nino “neutral” times (such as recently), the ice impact can have more of an effect.
And for this year, it looks like ice may well be having more of an effect. The geopotential height anomaly looks very much like what the models predicted as sea ice declined. The storm track response also looks very similar with correspondingly similar impacts on precipitation (reduced rainfall in CA, increased precipitation in SE Alaska). While other factors play an influence, the similarity of these patterns certainly suggests that we shouldn’t discount warming climate and declining Arctic sea ice as culprits in the CA drought.
NOAA and Prof. Jennifer Francis of Rutgers have more recently shown that the loss of Arctic ice is boosting the chances of extreme US weather.
Francis told me this week that “the highly amplified pattern that the jet stream has been in since early December is certainly playing a role in the CA drought.”
“The extremely strong ridge over Alaska has been very persistent and has caused record warmth and unprecedented winter rains in parts of AK while preventing Pacific storms from delivering rain to CA,” she explained. “But is this pattern a result of human-caused climate change, or more specifically, to rapid Arctic warming and the dramatic losses of sea ice? It’s very difficult to pin any specific weather event on climate change, but this extremely distorted and persistent jet stream pattern is an excellent example of what we expect to occur more frequently as Arctic ice continues to melt.”
While there is no doubt that climate change is making droughts more intense, the specific connection the loss of Arctic ice is emerging science, and some, like Trenberth, are skeptical that the case has been made.
Whether or not there is a proven link to the loss of Arctic ice, Senior Weather Channel meteorologist (and former skeptic) Stu Ostro has been documenting “large magnitude ridges in the mid-upper level geopotential height field” lasting as long as many months that “have been conspicuous in the meteorology of extreme weather phenomena.”
Ostro gave a talk last year (with Francis), and as Climate Desk summarized, “Ostro’s observations suggest that global warming is increasing the atmosphere’s thickness, leading to stronger and more persistent ridges of high pressure, which in turn are a key to temperature, rainfall, and snowfall extremes and topsy-turvy weather patterns like we’ve had in recent years.”
The climate is changing. “All of our weather is now, and increasingly in the future, influenced by climate change,” Gleick wrote me. “The question about attribution (i.e., is this drought caused by climate change) is, of course, the wrong question — easy for deniers to dismiss because it is not easy to show unambiguous links to some kinds of individual events.”
What is especially worrisome is that climate change has only just started to have an impact on Western droughts. We’ve only warmed 1.5 °F in the past century. Absent strong climate action, we are on track to warm 10 °F over the next century!
We continue to dawdle even though scientists have been warning us of what was coming for decades. Hansen himself co-authored a 1990 study, “Potential evapotranspiration and the likelihood of future drought,” which projected that severe to extreme drought in the United States, then occurring every 20 years or so, could become an every-other-year phenomenon by mid-century.
So we should listen to Hansen’s current warnings. In 2012 he warned in the NY Times of a return to Dust Bowls, writing, “over the next several decades, the Western United States and the semi-arid region from North Dakota to Texas will develop semi-permanent drought … California’s Central Valley could no longer be irrigated. Food prices would rise to unprecedented levels.”
Hansen repeated those concerns in an email to me this week, noting that the current drought “will break, of course, likely with the upcoming El Nino, but as long as we keep increasing greenhouse gases, intense droughts will increase, especially in the Southwest. Rainfall, when and where it comes will tend to be in more intense events, with more extreme flooding. These are not speculations, the science is clear.”
How long can these droughts last? They have lasted for decades in the distant past, and one 2010 study warned that we could see “an unprecedented combination” of multi-decade droughts “with even warmer temperatures.”
Drought researcher Aiguo Dai was quoted in a 2012 NCAR news release for a 2012 study warning, “The U.S. may never again return to the relatively wet conditions experienced from 1977 to 1999.”
This week I asked him, “Do you still stand by that statement?” He replied:
Yes, I still stand by that statement. The model projections have not changed. To the extent we can trust the CMIP [Coupled Model Intercomparison Project] model projections, I still think the U.S. will experience increased risk of drought in the coming decades. What has been happening during recent years in the central and western U.S. is very consistent to what I have been predicting: both the natural variability (IPO [Interdecadal Pacific Oscillation]) and human-induced climate change will increase the risk of drought over these regions for the next 1-2 decades. After that, the IPO may switch to a positive phase that normally would bring more rain over the U.S. regions, but by that time the human-induced warming have over-dominate the natural variability, with the U.S. regions still in drier conditions (compared with the 1980s-1990s).
Finally, a 2009 NOAA-led paper warned that, for the Southwest and many semi-arid regions around the world, “the climate change that is taking place because of increases in carbon dioxide concentration is largely irreversible for 1,000 years after emissions stop.” Impacts that should be expected if we don’t aggressively slash carbon pollution “are irreversible dry-season rainfall reductions in several regions comparable to those of the ‘dust bowl’ era.”
When the climate changes, it ain’t gonna change back.

Wednesday, January 29, 2014

Asian pollution climatically modulates mid-latitude cyclones following hierarchical modelling and observational analysis

Nature Communications, 5, article number 3098 (21 January 2014); doi: 10.1038/ncomms4098

Asian pollution climatically modulates mid-latitude cyclones following hierarchical modelling and observational analysis


Abstract


Increasing levels of anthropogenic aerosols in Asia have raised considerable concern regarding its potential impact on the global atmosphere, but the magnitude of the associated climate forcing remains to be quantified. Here, using a novel hierarchical modelling approach and observational analysis, we demonstrate modulated mid-latitude cyclones by Asian pollution over the past three decades. Regional and seasonal simulations using a cloud-resolving model show that Asian pollution invigorates winter cyclones over the northwest Pacific, increasing precipitation by 7% and net cloud radiative forcing by 1.0 W m−2 at the top of the atmosphere and by 1.7 W m−2 at the Earth’s surface. A global climate model incorporating the diabatic heating anomalies from Asian pollution produces a 9% enhanced transient eddy meridional heat flux and reconciles a decadal variation of mid-latitude cyclones derived from the reanalysis data. Our results unambiguously reveal a large impact of the Asian pollutant outflows on the global general circulation and climate.

http://www.nature.com/ncomms/2014/140121/ncomms4098/full/ncomms4098.html

Robert Way corrects Judith Curry's erroneous Senate testimony on Arctic warming


A Historical Perspective on Arctic Warming: Part One

by Robert Way, Skeptical Science, January 28, 2014
During her most recent Senate testimony, Dr. Judith Curry (Georgia Tech) repeated one of the most common misconceptions found in the blogosphere, that the Arctic was warmer than present during the 1940s. This period - known as the Early Century Warm Period (ECWP) - coincides with observations of reduced Arctic sea ice cover and allowed for more widespread ship navigation than during the late 1800s and early 1900s (Johanessen et al., 2004).

There are two elements to the contrarian views on the ECWP in the Arctic. First, they argue that during the ECWP the Arctic was warmer than present. Secondly they have used the ECWP as a means of casting doubt on the main drivers of global warming. These contrarians argue that internal climate variability caused the ECWP and that this internal variability may have contributed to recent Arctic warming, thereby suggesting that climate sensitivity to greenhouse gases may be lower than current estimates. Some of these discussion points have also somehow found themselves in the IPCC AR5's Chapter 10 where the following claim is made.
"Arctic temperature anomalies in the 1930s were apparently as large as those in the 1990s and 2000s. There is still considerable discussion of the ultimate causes of the warm temperature anomalies that occurred in the Arctic in the 1920s and 1930s."
Based on previous examination of the surface temperature record and also reading the literature on the topic, I found myself skeptical of this IPCC claim and by extension the contrarian views. Tamino expressed a similar sentiment in a recent article. In this post I will be examining the first element of the discussion and will evaluate whether "Arctic temperature anomalies in the 1930s were apparently as large as those in the 1990s and 2000s" is an accurate statement.

The challenge with describing Arctic surface air temperature changes is that the observational network is sparse, something we noted and corrected for in Cowtan and Way (in press). Using a single observational network therefore has the potential to mislead - particularly on short timescales. However, comparison of all available long surface temperature records for the Arctic (here defined as regions North of 60° N) shows relatively strong agreement amongst the various products (Figure 1). 

Arctic temps
Figure 1. Arctic annual surface air temperature changes from ~1900 to ~2013 relative to the 1901-2000 baseline. Top panel: combined land and ocean air temperatures; bottom panel: land-only air temperatures.
From the above graph it is also apparent that some temperature anomalies between 1930 and 1950 were well above the 20th century average, but they do not match the magnitude of those observed over the past decade for any complete record. Over longer timescales (120 months/10 years) this difference becomes more apparent with no records showing similar warmth to present in the Arctic during any previous period (Figure 2). One record (NansenSAT; Johannsen et al., 2008) shows greater mid-century warmth and less recent warmth relative to the other datasets; this dataset includes 20th century data from both Russian drift stations and Argo buoys, but the land station data comes from CRUTEM2v which has limited Arctic coverage. It should be noted that the record terminates in 2008 before several of the warmest years in the Arctic. 
Arctic temps
Figure 2. Centered rolling mean (120-month/10-year) of Arctic surface air temperatures from ~1900 to ~2008 (truncated at both ends) relative to the 1901-2000 baseline. Top panel: combined land and ocean air temperatures; bottom panel: land-only air temperatures. 
The Arctic surface temperature record presented by CW2014 is the most complete spatially due to its incorporation of interpolation (e.g., kriging) and has been validated against both Arctic buoys and satellite records during the recent period. It also shows a greater warming during the ECWP than other Land+Ocean records, therefore it is retained for comparing the ECWP and recent Arctic warming.

To compare the relative distributions of monthly anomalies we take the warmest 120-month period (10-year) during the ECWP and compare it to the warmest 120-month period during the recent warm period (Figure 3). Comparison of these two periods reveals a clear shift in the average air temperatures and also an increase in the probabilities of warm months over the past decade. Recently, it has also become increasinly rare for even a single month to have a below-normal average temperature, in contrast with the ECWP where this was common. 

warmest Arctic periods
Figure 3. Comparison of warmest 120-month (10-year) periods in Arctic surface air temperatures during the early century warm period and recent warm period using the CW2013 dataset. Left panel: density plots showing the frequency of temperature anomalies during both periods; right panel: box plots showing the minimum/maximum values, lower/upper quartiles and medians for both periods. This figure was updated due to mistakenly using HadCRUTv4 in the original.  
Based on the data presented above there is virtually no evidence that Arctic air temperatures were greater than present during any previous period of the last century. This is clearly a case where the IPCC should consider amending its text to provide a more accurate picture of Arctic temperature changes. In Part Two, the Early Century Warm Period will be discussed in the context of its causes and origins.

Supplemental:
CW2013 = Cowtan and Way Long-Kriged Global Temperature Product (after Cowtan and Way, in press). Discussed above.
GISS = Goddard Institute for Space Studies (Hansen et al., 2010).
HadCRUT/CRU = Hadley Climate Research Unit (Jones et al., 2012Morice et al., 2012).
NOAA/NCDC = National Oceanic and Atmospheric Administration's National Climate Data Center (Lawrimore et al., 2011Vose et al., 2012;).
BEST = Berkeley Earth Surface Temperature Project (Rohde et al. 2013).
NansenSAT = Nansen Environmental and Remote Sensing Center (Johanessen et al., 2004Kuzmina et al., 2008).

Nuccitelli, Painting & Trenberth: Warming oceans consistent with rising sea level and global energy imbalance

Key Points:
  • The ocean is quickly accumulating heat and is doing so at an increased rate at depth during the so-called “hiatus” – a period over the last 16 years during which average global surface temperatures have risen at a slower rate than previous years.
  • This continued accumulation of heat is apparent in ocean temperature observations, as well as reanalysis and modeling experiments, and is now supported by up-to-date assessments of Earth's energy imbalance. 
  • Another key piece of evidence is rising global sea level. The expansion of the oceans (as they warm) has contributed to 35–40% of sea level rise over the last two decades – providing independent corroboration of the increase in ocean temperatures.

The Deep Ocean Layers Are Quickly Accumulating Heat

Recently there have been some widespread misconceptions about heat accumulation in the oceans, particularly in the deeper layers below 700 meters.  Balmaseda et al. (2013) was a key study on this subject, using ocean heat content data from the European Centre for Medium-Range Weather Forecasts' Ocean Reanalysis System 4 (ORAS4).  (A reanalysis is a climate or weather model simulation of the past that incorporates data from historical observations. In the case of ORAS4, this includes ocean temperature measurements from bathythermographs and the Argo buoys, and other types of data as for example, sea surface height and surface temperatures.)  Their study concluded that heat has increased in the deep oceans at an unprecedented rate in recent years, with approximately 30% being sequestered below 700 meters since the year 2000.
OHC
The five ensemble members of the ORAS4 ocean reanalysis OHC for 0–700 m and full-depth ocean are shown, where they have been aligned for 1980 to 1985, in 1022 J. The increased heating below 700 m of about 0.2 W/m2 globally is revealed after about 2000.  The orange bars show the times of the El Chichón and Pinatubo volcanic eruptions.  From Trenberth and Fasullo (2013).
The increase in deep ocean heat content is also a robust result in data sets that do not include reanalysis. For example, as discussed in Nuccitelli et al. (2012), the ocean heat content data set compiled by a National Oceanographic Data Center (NODC) team led by Sydney Levitus shows that over the past decade, approximately 30% of ocean heat absorption has occurred in the deeper ocean layers, consistent with the results of Balmaseda et al. (2013).
Fig 1
Land, atmosphere, and ice heating (red), 0-700 meter OHC increase (light blue), 700-2,000 meter OHC increase (dark blue).  From Nuccitelli et al. (2012)
Similarly, a new paper by Lyman and Johnson (2013) concludes,
"In recent years, from 2004 to 2011, while the upper ocean is not warming, the ocean continues to absorb heat at depth (e.g., Levitus et al., 2012; von Schuckman & Le Traon, 2011), here estimated at a rate of 0.56 W m-2 when integrating over 0–1800 m."
The paper also includes this useful table illustrating that according to observational data, ocean heat content has indeed accumulated rapidly in the deep oceans in recent years.  Of the heat accumulating in the upper 1,800 meters of oceans for 2004–2011, 46% was sequestered in the deep oceans (below 700 meters) in the Lyman and Johnson data set.
LJ13 Table 1
For 2004–2011, they find the oceans accumulating 0.56 W/m2 (9 x 10²¹ J/yr) in the upper 1,800 meters – equivalent to 4.5 Hiroshima atomic bomb detonations per second – during a time when many have argued that global warming has magically "paused."
There are some differences among these studies, although all agree that the deep ocean is taking up more heat recently.  The differences arise from how gaps in observations are filled in time and space, and the reanalyses do this most comprehensively by utilizing all kinds of data as well as using ocean models to span gaps.

Ocean Heat Accumulation Consistent with Other Observations

We also know from satellite observations that the planet is accumulating heat owing to a global energy imbalance.  A new paper by Trenberth et al. (2014) notes that the amount of heat accumulating in the global climate (most of which is absorbed by the oceans) is generally consistent with the observed global energy imbalance.
Due to the increased greenhouse effect 'trapping' more heat, there is more incoming than outgoing energy at the top of the Earth's atmosphere.  That energy has to go somewhere.  With over 90% being absorbed by the oceans, we fully expect the oceans to do exactly what they are doing – accumulate a whole lot of energy. What's more, continually increasing greenhouse gases increase the imbalance by about 0.3 W/m2 per decade even as the planet warms and radiates some extra heat back to space.  If global warming were to "pause," it would require an explanation of where the energy from the global imbalance is going.
There is also the issue of sea level rise, whose main contributors are melting glaciers and ice sheets, and thermal expansion (water expanding as it warms).  Climate scientists have been able to close the sea level "budget" by accounting for the various factors that are causing average global sea levels to rise at the measure rate of about 3.2 millimeters per year since 1992 (when altimeters were launched into space to truly measure global sea level).  The warming oceans account for about 35–40% of that rate of sea level rise over the past two decades, according to the IPCC AR5.  If the oceans weren't continuing to accumulate heat, sea levels would not be rising nearly as fast.

The "Pause" is a Fiction; Ocean Warming is Factual

The bottom line is that all available information related to ocean heat content shows that the oceans and global climate continue to build up heat at a rapid pace, consistent with the global energy imbalance observed by satellites and the rate of global sea level rise.  In recent years, about one-third of that heat has accumulated in the deep oceans.
While the rate of increase of global surface temperatures in recent years has slowed in large part due to the more efficient heat transfer to the deep oceans, that can't last forever.  A key reason is that sea level rise occurs unevenly, and in some places, such as near the Philippines, sea level has risen over 20 cm since 1992, while in other places it has fallen slightly.  In particular, the slope of the ocean surface across the Pacific has increased by 20 cm, and the water wants to slosh back but is prevented by stronger easterly trade winds.  The resulting changes in ocean currents are part of the reason why more heat has gone deeper. 
When that trend reverses, as past observations suggest it will (likely within the next decade, according to Trenberth and Fasullo [2013]), we'll experience an acceleration in warming at the Earth's surface.